Red Kettles, Panda Bears and Mission Statements.
Or, what the heck is salience and why does it matter?
Ask someone what The Salvation Army does.
Most people couldn't recite its mission statement. They probably couldn't describe its history or explain the programs it offers. They may recall the red shield on the Salvation Army stores. What they likely remember is the Red Kettle sitting outside the grocery store and the volunteer ringing a bell in December. When they hear that bell and see that kettle, many instinctively reach for a few dollars to put into the red kettle to help someone they will likely never meet.
A similar dynamic is true for WWF - World Wildlife Federation. Most people couldn't explain its conservation strategy or list the species it protects, but many know its iconic Panda Bear logo. Similarly, if you walked up to any adult and sang “1-877”, there’s a good chance they’ll continue “Kars 4 Kids. K-A-R-S, Kars 4 Kids.”
None of these organizations became memorable because they explained themselves better. They became memorable because they became easy to recognize and easy to remember.
That brings us to one of the simplest, but important ideas in marketing today, and one that is surprisingly absent from many nonprofit marketing and fundraising conversations: salience.
Salience is simply how easily your nonprofit comes to mind when someone has a moment to give, volunteer or advocate. Often referred to as distinctive assets, shortcuts are created by images (the WWF panda), names (Make-A-Wish), lines ("A mind is a terrible thing to waste."), sounds (the Salvation Army's hand bells at Christmas), or even colors. It less about whether someone agrees with you or admires your work. It's about whether your organization even comes to mind in the first place.
Many nonprofits still approach marketing as a persuasion exercise, investing enormous resources and effort refining our mission statement, telling deeper stories and explaining our impact more clearly. It's understandable. We live our mission every day, so it's natural to believe that explaining it more often or with more depth will inspire more support.
Research from the Ehrenberg-Bass Institute and others have consistently shown that organizations grow by increasing penetration through mental and physical availability. Put simply, growth comes from becoming known to more people, becoming easier to think of when the opportunity arises and making it easy to participate. We've shared before that nonprofits are roughly 14 times more likely to be unknown than actively rejected. For most organizations, the biggest obstacle to growth isn't convincing people to support their mission. Rather, it’s just being remembered that’s the challenge.
One of the things I've come to appreciate working with nonprofits is how often we assume people make careful, considered decisions about which organizations (yes, plural, with the typical donor giving to 3 to 5) to support. We imagine someone comparing mission statements, evaluating impact reports, reviewing Form 990s or Google-ing Candid, to toggle between one nonprofit or another’s rating before making a gift. Occasionally that happens, particularly with major philanthropy, grants or foundation giving. But for most individual giving, that's not how it works.
Life is complicated. Priorities change. Financial situations are dynamic. So, they may give after seeing your organization at a community program. A friend mentioned it. They volunteered there years ago. They recognize your logo or a signature event. Or, they've heard your name enough times that it feels familiar and trustworthy.
Before someone can evaluate your mission, they first must remember you exist.
That's why the Red Kettle and the WWF Panda work. They are a memory shortcut, allowing people to recognize the organization and connect it with a need or opportunity without having to process paragraphs of explanation.
Your mission statement is important. It guides your organization, aligns your staff and communicates your purpose. It keeps you focused on impact. However, mission statements rarely build memory. Distinctive assets do. Showing up consistently over time and garnering attention does.
The next time your team sits down to develop your annual marketing or fundraising plan, start by reading your mission statement and set it aside for a moment. Then, ask yourself: when someone has a moment to care about the work we do, what will make them think of us?
If you’re interested to learn more, contact us!
What If Nonprofit Members Want More Than Just Membership?
From professional associations to public media to cultural and community nonprofits, membership organizations can look very different from one another. However, most are wrestling with the same challenges. Membership growth has slowed and member engagement is declining. Long-standing assumptions about what members want are being tested.
In my conversations with membership organizations, the discussion usually circles around the key question:
What makes membership valuable?
Membership models, benefits, events, pricing, and engagement strategies all matter. But they are ultimately expressions of something more fundamental: the member value proposition.
For decades, membership was largely transactional. I joined and got something in return: information, credentials, discounts, access, or benefits.
Over time, many organizations expanded that definition. Membership became less about what members got and more about what they experienced. Conferences became destinations. Museums expanded programming to indie film seminars and DJ Nights. Zoos offered holiday extravaganzas. Public media organizations created live events and speaker series.
Membership value propositions expanded from “I get” to “I experience”.
The Rise of Participation?
What has captured my attention recently is that the notion of membership value may be changing. Or, at least, that another path for membership may be emerging.
Participation. “I build the mission and delivery.”
In my mind, participation isn't the same as supporting a mission through member conferences, peer connections, donations or volunteer service. I think of members contributing to and becoming part of how the mission's value is created rather than simply supporting the organization that creates and delivers it.
Wikipedia is a good example.
Although most people don't think of it this way, Wikipedia is a nonprofit with an interesting model. Its content is freely available. There are no discounts, premium content offerings, gifts, or exclusive experiences.
Yet millions of people give money and time by editing articles, moderating discussions, and helping steward the platform. People aren't simply receiving value from Wikipedia. They're directly contributing to its mission of providing free access to the sum of all human knowledge.
Wikipedia isn’t alone. Open-source software communities operate in much the same way. Contributors write code, improve documentation, identify bugs, and maintain tools used by millions of people around the world. Public media organizations are experimenting with inviting audiences to create and share material, ideas, and reporting leads.
Technology is almost certainly part of this story. Today, participation can happen at a scale that wouldn’t have been possible a generation ago. Millions contribute to Wikipedia. Open-source communities build products used around the world. Public media organizations can invite audiences into reporting, conversations, and content creation. Reddit has provided the means and proven that a disconnected group of people can coalesce around ideas and passions.
What If?
It's fun to think about how this might work for nonprofits.
What if public media become media platforms for member, community-created journalism and programming by providing airtime, training, and editorial guidance?
What if museum members curate the exhibits from the museum’s vast, unseen collections?
What if associations organize around shared problems rather than industries or professions, crowdsourcing solutions to challenges like supply chains, workforce development, or technology adoption?
I don’t know if these are good ideas or not. And this may not be the solution for every organization.
What I do know is that nonprofit membership organizations and associations are under pressure, and the strategic opportunities are worth considering.
Organizations built primarily around access to information will likely face continued declining membership and engagement as AI, YouTube, webinars, and other tools make information abundant and accessible. Organizations built around experiences may be challenged to keep those experiences distinctive in a crowded marketplace.
Participation could offer a way to address these challenges. It can be difficult to replicate because it is directly tied to the mission, the community, and the unique contributions members bring.
Whether participation becomes a feature of future membership models remains to be seen. But if membership has always been about creating value, organizations may want to at least explore participation as they evaluate and strengthen their member value propositions.
Dissent, dignity and nonprofits.
In his Booker Prize shortlisted novel Harvest, Jim Crace writes, “Dissent is not counted. It is weighed.”
I’ve reflected quite a bit on those words during my nonprofit journey. I’ve seen that power is rarely distributed evenly, so voices without structure or authority are easy to dismiss. They are weightless.
The question is not, however, whether dissent exists in that vacuum. It does. The question becomes whether it carries weight.
Dissent comes in many shapes and sizes. Sometimes, like during the recent Ice Surge in Minneapolis, it filled the streets with marches, signs, chants, whistles, and drums. It also arrived quietly through neighbors escorting children to school, or providing food, clothing and goods to those who were fearful of leaving their home.
Art has always lent weight to dissent. Murals. Literature. Music. Blogs. Paintings, labeled Entartete Kunst (“degenerate art”) in Nazi Germany, challenged power and conformity to abusive, immoral and lethal policies.
At its core, dissent is our refusal to accept that broken systems, injustice, and indifference are just the way things are. In that sense, nonprofit work may be one of the most powerful forms of dissent we have.
Nonprofits don’t merely criticize problems; they build alternatives. A food pantry declares hunger unacceptable. A housing organization rejects the idea that home stability belongs only to the fortunate. A youth mentoring program pushes back against hopelessness. Public media insists that truth, curiosity, and civic dialogue still matter. Nearly every nonprofit mission, in its own way, says “together, we can build something better.” They add weight.
That is what makes nonprofit work different from outrage alone. Protest can demand change and sometimes provoke it. Nonprofits do the slow, hard work of creating it. Day after day, many individuals and organizations step into the gaps left by markets, politics, biases, systems, and institutions. They create opportunity and advocate for human dignity. They turn values into action.
To give time, money, expertise, or attention to a nonprofit is not solely an act of charity. It is a declaration about the kind of society we believe should exist. And, through the time, money, expertise, or attention we give, we add more weight to our dissent and move a little closer to becoming that society.
For me, that is why nonprofits matter and deserve our support.
Breakfast, donor trust, and donor intentions. What happens when what we say isn’t what we do?
Key Takeaways
Donor behavior doesn’t match stated intentions. What donors say about giving differs from their actions.
Trust influences giving, but only a bit. It explains about 5% of the variation in donor behavior.
Donor intent is unreliable. Many planned donations don’t happen, while many unplanned donations do.
Giving is situational, often momentary. Relevance, timing, and ease drive action. .
Article
Most Americans believe breakfast is important.
Surveys show that about 75% of Americans say breakfast is the most important meal of the day.¹ Based on this, one might conclude Americans are dedicated to a sound morning breakfast routine. As a marketer, I’d feel confident building a brand around the importance of a healthy, complete breakfast.
Their behavior tells a different story. Only about 35% eat breakfast every day,² and roughly 1 in 6 adults don’t eat breakfast at all on a given day.³ That gap in intention vs behavior changes the marketer’s challenge entirely.
As a marketer with this data, understanding factors like preparation convenience, mobility, time constraints, and on-the-go lifestyles becomes critical with this data. Those realities should shape product, messaging, potential partnership, and distribution strategies.
Even for something people broadly agree is important like breakfast, behavior is inconsistent or absent altogether. This gap between what people say they believe and what they do isn’t unusual. It’s a well-documented pattern in behavioral research.
Why this matters for nonprofit development.
Nonprofit leaders hear a similar version of this all the time: trust is the most important factor in donor decision-making. Surveys consistently show that up to 60% - 70% of donors say trust is essential or highly important when deciding where to give, and that higher trust increases their likelihood to support an organization.⁴
It sounds reasonable, reinforces what many organizations already believe and sets a course of action: invest in trust, increase transparency, improve reporting, strengthen credibility, focus on donors who know us.
But there’s a problem. Like with eating breakfast, what donors say and what they do with giving can be very different things and with very different implications for key strategies.
What empirical data shows about trust in donor giving.
Survey data tells us what people believe, and what they think they will do. Empirical data, on the other hand, doesn’t ask people what matters. It observes what people do (with statistical analysis). When researchers look at donor giving through that lens, the role of trust becomes much more nuanced.
Last week we highlighted the meta-analysis by Chapman, Hornsey, and Gillespie, published in Nonprofit and Voluntary Sector Quarterly, which examined charitable giving studies covering more than 80,000 individuals across 31 countries. It found that trust explains about 5% of the variation in giving behavior.⁵ Certainly a positive, but a slight one.
This all doesn’t mean trust doesn’t matter. It does. But it is a relatively small part of a much larger system of influences on donor giving. People give for a variety of reasons such as emotional connection, personal relevance, social context, and timing—many of which do not depend on organizational trust at all⁵.
And, there’s more…
Even if trust played a larger role, it still wouldn’t fully explain giving behavior, because intention itself is unreliable. A study from the Ehrenberg-Bass Institute examined what people intended to do versus what they actually did when it came to donating money, goods, or time.
The results of the study: about 37% of people who intend to give don’t follow through.⁶ At the same time, roughly half of people who did not intend to give end up giving anyway.⁶
In other words, intention is not a reliable predictor of behavior. People give for a range of reasons, and that’s the “95%” in donor variance beyond trust. Warm fuzzies. Top of mind. A friend mentioned the organization…the list goes on and on.
It’s just real life.
Take a moment and consider giving from a typical person.
Most don’t sit down and deeply evaluate an organization before deciding to give. More often, it happens in the flow of life. A cause feels relevant. A friend or neighbor mentions it. A direct mail piece shows up at the right time. Something connects and we act. And just as often, we don’t.
Not because we don’t trust the organization, but because the moment isn’t right. We’re busy. We have other priorities. Maybe finances are tight this month. Maybe something in life has shifted and our attention is elsewhere.
That “95%” isn’t randomness. It reflects how people live and have to make decisions.
In that context, giving is less about careful evaluation and more about presence, relevance, and ease. It’s about whether an organization shows up in the right way, and comes to mind at the right moment, with a clear path to act.
Addressing the other “95%” of donor giving.
To best address the “95%” of donor behavior beyond trust, a few consistent drivers emerge:
Distinctiveness — clear positioning and recognizable assets that are uniquely yours and easily come to mind
Being known — more often than not, the challenge isn’t rejection; potential supporters don’t know you exist
Reach — speak to as broad an audience as is reasonable and possible, not just a narrow base of committed supporters
Timing — be present on their time, not yours, i.e. beyond the annual campaigns
Ease — make it simple and accessible for people to support you whenever their interest arises
For nonprofits, especially small and mid-sized organizations, this reframes the challenge. Growth isn’t just about deepening relationships with existing supporters.
Be noticed, be remembered, and be easy to support.
I look forward to hearing your thoughts and experiences!
References
¹ CivicScience, Breakfast Trends / Importance of Breakfast
² CivicScience, Breakfast Consumption Frequency
³ U.S. Centers for Disease Control and Prevention (CDC), NHANES dietary data (MMWR)
⁴ BBB Wise Giving Alliance (Give.org), Donor Trust Report
⁵ Chapman, C. M., Hornsey, M. J., & Gillespie, N. (2021), To What Extent Is Trust a Prerequisite for Charitable Giving? A Systematic Review and Meta-Analysis, Nonprofit and Voluntary Sector Quarterly
⁶ Nguyen, C. et al. (2022), Mind the Gap: Understanding the Gap Between Intentions and Behaviour in the Charity Context, Journal of Business Research
Is trust the driver of donor giving?
Spending time in nonprofit strategy conversations I often hear a version of this: trust is everything. It underpins fundraising, communications, brand, even governance. Build trust and donors will come. Strengthen trust and they’ll stay.
It’s a seductive idea, and an understandable one. Trust feels foundational, especially in mission-driven work where credibility and integrity matter. And to be clear, it isn’t wrong.
But it is incomplete. And potentially distracting.
When you move beyond intuition and look at the evidence, trust starts to look less like the key engine of donor growth.
The research: Trust isn’t a major driver for giving
A large meta-analysis of charitable giving published in the Journal of Economic Psychology by Arno R. Kootstra, Pamala Wiepking, and René Bekkers (2021) confirms what most of us would expect: trust and giving are related.
As the authors note, “there was a positive relationship between trust and charitable giving.”¹ This statement aligns with both experience and common sense. People are more likely to give to organizations they believe are credible and aligned with their values.
What is less commonly discussed is the strength of that relationship. The study reports that trust translates to roughly 5% of the variation in giving behavior.¹ While not insignificant, it is not decisive. Trust plays a role, but it is a relatively modest one in the context of everything that influences giving.
Why is this the case?
A closer look at the research adds important nuance and insight. Trust is not uniform; trust in a specific organization has a stronger relationship with giving than general trust in institutions. This is encouraging, as it suggests that how an organization behaves and communicates can influence donor perceptions.
As the study notes, however, many motivations for giving “do not rely on a relationship of trust.”¹ People give for a range of reasons, many of which have little to do with trust. Emotional connection, personal identity, timing, and context all play a role.
Equally important is the nature of the relationship itself. The findings do not establish whether trust leads to giving or whether giving builds trust.¹ It is possible that trust is not the starting point of the relationship, but something that develops as people engage with an organization and experience its impact.
Trust becomes an over-weighted strategy
The challenge for many organizations is not that they value trust, but how that value gets translated into strategy. Over time, “trust matters” has become “trust drives growth,” and that shift, subtle as it is, begins to shape decisions.
You can see it across strategy as well as time and budget allocation. Organizations invest heavily in deepening relationships with existing supporters, place significant emphasis on retention, and develop messaging that is careful and often the same to that of their peers. These are reasonable responses if trust is assumed to be the primary driver.
As a result, organizations often double down on what they feel they can control. They deepen communication with existing donors, invest further in stewardship, and focus on retention. All of this is valuable, but it does not expand the base of support.
Keeping focused on growth
Stepping back from the idea that trust is the primary growth driver, raises a practical question: what promotes growth?
Looking at organizations that do grow, a different pattern becomes apparent. Yes, they are trusted. They also build distinctiveness, reach beyond their existing base, show up consistently in ways that make them memorable, and create clear, simple pathways to engage.
Being noticed, being remembered, and being easy to support are what make growth possible. They bring new people into the system and create opportunities for further engagement.
This dynamic is especially true for small and mid-sized nonprofits. These organizations often have strong missions, committed teams, and loyal supporters who trust the work being done. Yet growth can feel slow or uneven because the organization isn’t known, visibility is inconsistent, or it is not present in the moments when potential supporters are ready to act.
Some practical learnings
For organizations under a few million in revenue, this has very real implications. It suggests that your growth is less about proving credibility to the people who already know you and more about reaching those who don’t.
That means shifting focus in a few practical ways:
Expand your reach beyond your current base
Growth requires new people. If most of your time, budget and communication are going to existing supporters, you’re reinforcing loyalty, not expanding it.Prioritize being remembered, not just understood
Clear messaging matters, but distinctiveness matters more. If you don’t stand out, you won’t come to mind when the moment to give arrives.Show up consistently, not just at campaign moments
Intermittent visibility limits growth. Consistent presence builds familiarity, which increases the likelihood of engagement over time.Make the giving path simple and obvious
When interest turns into intent, friction matters. If it’s not clear how to help, or if it feels like work, many people won’t follow through.Balance acquisition with retention
Stewardship is essential, but it cannot carry growth on its own. Expanding the base is crucial.
Growth comes from being noticed, remembered and easy to support. None of this replaces trust-building. It does, however, widen our aperture to create the conditions where trust can form and your nonprofit can grow.
I’d be interested in your perspective. And, if you’re wondering how this applies to your organization, please reach out.
Mike
mike@depauw-co.com
Reference
¹ Kootstra, A. R., Wiepking, P., & Bekkers, R. (2021). The relationship between trust and charitable giving: A meta-analysis. Journal of Economic Psychology.
Levers to nonprofit growth: Why “Retention Is Cheaper” May Lead Nonprofits Astray…(Pt. 2)
In Part 1, we walked through the math behind the familiar idea among nonprofits that retention is cheaper than acquisition and how that comparison is more sensitive to assumptions than it first appears. Using the Cost Per Dollar Raised metric to determine/evaluate strategy is tricky. In realizing that efficiency is not the same thing as growth, we should be sure that the efficient math doesn’t deter us from understanding growth drivers in our marketing, fundraising and development.
So, let’s step away from modeled metrics and look at what observational and empirical research says about how organizations grow.
What the research shows
Across decades of research, including work from the Ehrenberg-Bass Institute and captured in How Brands Grow by Byron Sharp, there’s a consistent pattern: growth tends to come from reaching more people, not just getting more from the people you already have.
That pattern shows up in nonprofits as well. Research into donor behavior suggests that most supporters give infrequently - often once or twice per year - while only a small group gives on a regular basis.¹ This distribution isn’t unusual; it’s a reflection of how participation tends to work across categories and geographies. Taken together, it leads to a simple way of thinking about it for nonprofits: retention maintains, acquisition grows.
What this means in practice
None of this makes retention unimportant. It matters, and for many organizations, loyal supporters are the foundation that keeps things stable over time. However, it does challenge the weight we place on retention as a path to growth.
When retention becomes the primary focus, it shifts attention toward a relatively small group of existing supporters. Over time, that can mean less investment in reaching new people and fewer opportunities to expand the base. At a very practical level, it’s worth remembering you can’t retain people who were never reached in the first place.
The real constraint might be simpler than we think
A lot of nonprofit strategy is built around the idea that the primary barrier is persuasion - getting people to care more, trust more, or feel more urgency. The research suggests something more fundamental.
In one study of charitable support, non-awareness was found to be 14 times higher than active rejection.² Most people weren’t choosing not to support a given organization; they simply didn’t know it existed. That reframes the challenge in a meaningful way. It’s not that people are unwilling. It’s that they’re unaware.
And even when people do know you…action isn’t guaranteed
Awareness alone, though, doesn’t ensure action.
When someone knows an organization and even intends to support it, that intention doesn’t always translate into behavior. Research shows that people frequently don’t follow through because of time, effort, or simple complexity. At the same time, people who didn’t initially plan to give sometimes do, often because something brought the organization to mind at the right moment.³
So there are really two constraints working at the same time: people don’t give because they don’t know you, and even when they do, small amounts of friction can stop them. Growth, therefore, depends not just on being known, but on being easy for potential donors to act on.
5 Levers of Growth
If you step back and connect this to Part 1, a clearer picture starts to form. The math suggests the gap between acquisition and retention may not be as wide or as certain as it’s often presented. And even if retention is more efficient, efficiency alone doesn’t determine growth.
At the same time, the research points in a consistent direction: organizations grow by reaching more people, not just by getting more from the people they already have. And layered into that, behavior research adds another important dimension: even when people are aware and willing, they don’t always act if the path is unclear or fraught with effort.³
So, what does all this mean in practice?
1. Reach is critical to a growth strategy
Reach isn’t just an output of campaigns. It’s a system to be built and something to plan for.
It’s easy to focus on response rates, conversion, or ROI from individual efforts. But growth is also a function of how many people encounter your organization in the first place. If more people need to know you before they can support you, then expanding reach has to be intentional.
2. Design for the many, not just the few
Most donors will never engage deeply or frequently, and that’s not necessarily a problem to solve.
Growth tends to come from a broad base of donors doing a little, rather than a small group doing a lot. So, the question shifts from how to deepen every relationship to how to make it easier for more people to participate at some level.
3. If you’re not remembered, you’re not chosen
If awareness is a key barrier, then distinctiveness and clarity start to matter more than perfection.
Being recognizable, easy to recall, and clear in what you do creates the conditions for support later on. People can’t choose you if they don’t think of you or are overwhelmed with deep mission and storytelling craft.
4. Reduce friction wherever you can
Even small amounts of effort or complexity can stop action. If well-intentioned supporters don’t follow through, simplifying the path matters. Fewer steps, clearer options, and more obvious next actions can have an outsized impact.
5. Balance, not trade-offs
This isn’t really an argument against retention. Retention plays an important role in maintaining stability and deepening connection. However, growth tends to come from bringing new people in. Both matter; they just do different jobs. I’ve read some academics refer to this as a “bar bell” approach – an idea that I’d like to explore further, later.
The acquisition vs. retention conversation often gets framed around efficiency using math that is based on a variety of assumptions. Growth isn’t just about doing things efficiently. It’s also about doing the right things, enough times, with enough people.
For many nonprofits, that means reaching more people, being easier to notice, and making it simpler to act. Because in the end, strong missions don’t grow because they are deeply understood by a few. They grow because they are known and supported by many.
I suspect this is a shift in perspective for many in our nonprofit community, and I’d welcome how others to share their perspectives or to reach out for further information. Thanks! Mike.
References - Part 2
Faulkner, M., Romaniuk, J., & Stern, P. (2016). New vs Frequent Donors: How Nonprofit Fundraising Mirrors Brand Loyalty Patterns. Australasian Marketing Journal.
Faulkner, M., Truong, Y., & Romaniuk, J. (2016). Barriers to Increasing Donor Support: Evidence on the Incidence and Nature of Brand Rejection. Nonprofit & Voluntary Sector Quarterly.
Nguyen, C., et al. (2022). Mind the Gap: The Intention–Behaviour Gap in Charitable Giving. Journal of Business Research.
Why “Retention Is Cheaper” May Lead Nonprofits Astray…(Pt. 1)
One of the most widely repeated ideas in nonprofit marketing and fundraising goes something like this: it costs far more to acquire a new donor than to retain an existing one.
The claim often appears in presentations and articles, accompanied by a familiar statistic suggesting nonprofits may spend about $1.50 to raise a dollar from a new donor, compared with roughly $0.20 to raise a dollar from an existing one.
At first glance, the conclusion feels obvious. If retention is so much cheaper, why not focus our efforts on that?
To be clear, before going further, retention in the nonprofit sector matters. Loyal supporters help maintain organizations, deepen connections to the mission and are often some of the most important donors, volunteers and advocates. But when we step back and look carefully at the math and the research behind these comparisons and what drives growth, we may be a bit less dogmatic about this metric.
What the statement actually means
When people say acquisition is more expensive than retention, they are usually referring to a common fundraising metric: cost per dollar raised. The math itself appears straightforward. You divide the cost of a campaign by its revenue. Using the commonly cited example, the comparison might look like this:
Retention Campaign Acquisition Campaign
$10,000 cost ÷ $50,000 raised $75,000 cost ÷ $50,000 raised
= $0.20 to raise $1 = $1.50 to raise $1
Looking only at those figures, retention appears dramatically more efficient. But the vulnerability in the data is that this is essentially a mathematical model rather than observed or empirical. Meaning, it is a calculation that is based on assumptions, equations and logic.
So, let’s look more closely at the math. In practice, comparisons between acquisition and retention can encounter two measurement challenges: numerator problems and denominator problems. Let’s look at a couple:
The numerator represents the cost of the campaign. For acquisition programs, those costs, such as advertising, direct mail, events, or outreach to bring new supports into the organization, are often visible and easily accounted.
Costs can be a bit more opaque for retention efforts. For example, these campaigns often rely on infrastructure that already exists. Email platforms, CRM systems, stewardship programs, communications teams, and organizational overhead all help sustain donor relationships. Those costs are real, but they are not always fully allocated when retention efficiency is calculated.
There are other considerations as well. For example, every donor who can be retained was originally acquired through some earlier investment, and these costs are often not factored into the calculation. When the historical acquisition costs are excluded, retention programs can appear less expensive than they truly are.
The denominator, the revenue attributed to the campaign, can introduce its own complications.
Retention programs often count all returning donors of the retention effort. Yet some of those donors may have given again regardless of the campaign. This raises a question of proper attribution. Research suggests donor loyalty exists, although limited. Several benchmark studies report up to 20–30% of first-time donors give again the following year.² ³
A simple illustration
Using the previously mentioned items, the table below shows how the comparison can change when different assumptions are applied to the numerator and denominator.
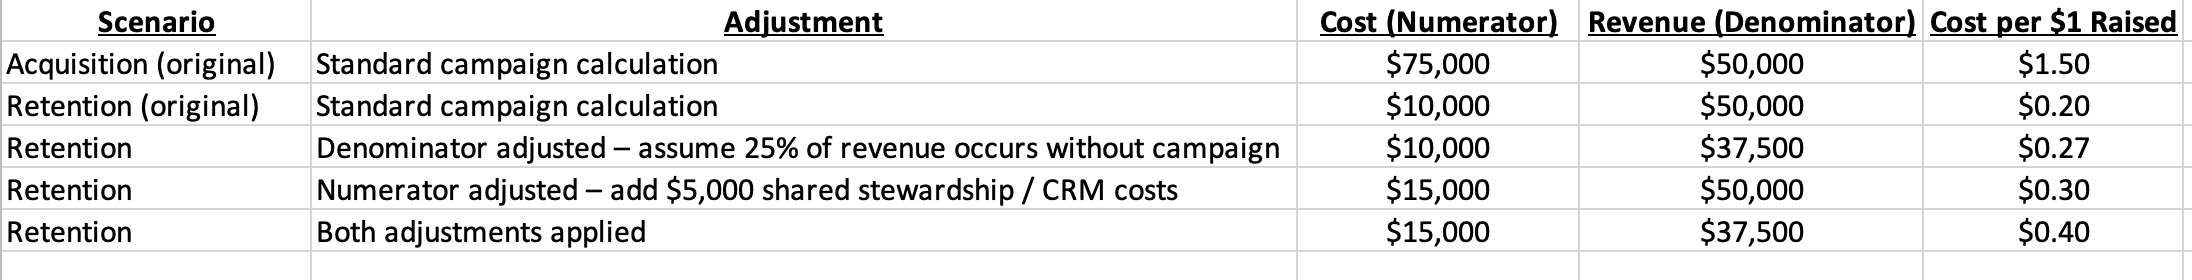
These figures are illustrative, used simply to demonstrate how the math works. The goal is not to prove a specific cost difference, but to show how sensitive the comparison can be to the assumptions built into the numerator and denominator.
For the purpose illustration, we’ll use 25% as a midpoint assumption for naturally recurring donations - that is, the folks who would have given in any case, regardless of a specific retention campaign. Also, we’ll assume $5000 of shared existing costs to be allocated into the costs.
Retention is still more efficient. But in this example the cost per dollar raised via retention doubled, and you can see how the cost gap begins to narrow. Importantly, this illustration doesn’t begin to account for other impactful influences like previous outreach/contact impact on retention. Also, retention costs are typically calculated only on donors who give again (excluding those who lapse) while acquisition includes all failed attempts. This creates a form of survivorship bias that overstates the efficiency of retention and understates the long-term value of acquisition.
I don’t want to suggest the measurement is completely meaningless. And retention may be more cost efficient than acquisition. Still, it does demonstrate that this one metric is subject to a wide range assumptions that do not make it as concrete as it is sometimes portrayed. More importantly, I fear, the comparison as oft-quoted (i.e. $1.50 for acquisition vs. $.20 for retention), deters and distracts nonprofits away from pursuing the key strategic lever for growth - donor acquisition.
Another, bigger question. If the math behind the acquisition-versus-retention debate is more complicated than it first appears, an important question follows. What does observational and empirical research say about how organizations grow when considering acquisition vs retention?
Next, we’ll step back from the math and look at what research reveals about how organizations grow and why reaching more people may be the necessary ingredient in many nonprofit marketing and development strategies.
I’d love to hear your thoughts and experiences in the math of donor strategies!
References — Part 1
1 Fundraising Effectiveness Project (2023). Fundraising Effectiveness Project Report.
2 Bloomerang (2023). The State of Donor Retention.
This economy is brought to you by the letter K
It’s not news that the U.S. has entered a phase of deep social and political polarization. We continue to argue about topical issues that range Presidential ballrooms, and Bad Bunny v Kid Rock, to tariffs, Iran, and immigration, but, I fear, we are not addressing the key underlying causes. This is about one such cause.
If you have been keeping abreast of recent economic data and analysis, you may have come across the term— “K-shaped” economy. This descriptor appears to have its origins in the early 2000s and the initial impact of 1980s Reagan-era deregulation and economic reorganization.
In essence, the arm of the K (the upper diagonal) signifies the increasing economic wealth and consumption concentrated amongst the wealthiest Americans, while the leg of the K (the lower diagonal) signifies the decreasing economic wealth and consumption concentrated amongst the less wealthy.
(Interestingly, where the three lines intersect is called the “crotch”—reflecting where most of us get kicked on our path to lower wealth and consumption.)
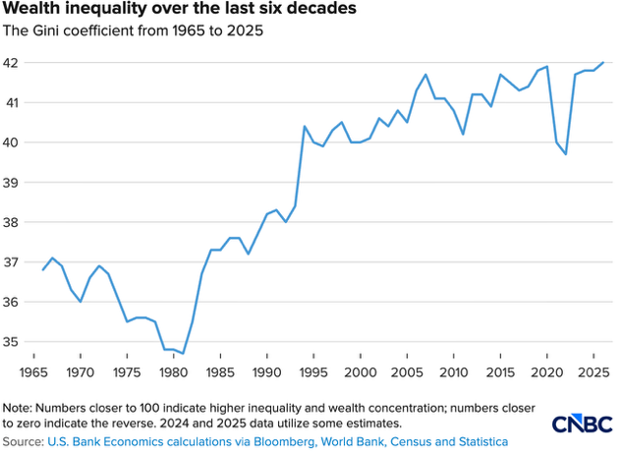
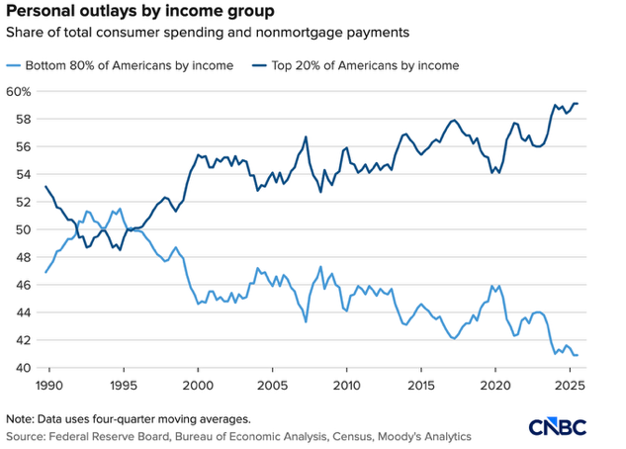
The top 1% of our households now account for 32% of total net worth. According to the Gini Coefficient, which measures relative wealth inequality, we have reached 42 which is a 60-year high in the gap. In addition, current data shows the top 20% of Americans by income make up about 60% of consumer spending. Et voila. Welcome to the K-shaped economy.
So, when headline numbers about national GDP or unemployment or real income growth are presented, they often mask the problem. And one already disproportionately felt by minority communities. Real income is up this quarter! GDP is solid this month! Travel spending is up! These gains are likely being enjoyed by the top quintile in the country. For those of us in the other four quintiles, we are in an “affordability crisis.”
The implications of a K-shaped economy can be profound. History has shown that over time societies don’t tolerate this sort of grand wealth divergence very well. In fact, the historical outcomes of this wealth difference are already manifesting: increasing social and cultural inequalities, declining trust in government and institutions, regulatory capture by the wealthy and elite, eroding civic participation and civil behaviors, and…higher polarization. Generally, the resolutions of these outcomes have ranged from major policy reform (USA 1900s and 1940s) to revolution and civil war (France, 1790s; Russia 1920s) to state collapse (Roman Empire).
Without an aligned vision and concerted policy effort from political leaders, this trend will continue, with meaningful mid- to long-term implications for communities and for nonprofits, particularly 501(c)(3) organizations. First, recognize this is a secular trend. Demand for services continues to grow for the foreseeable future as economic pressures widen. Second, donor concentration will likely intensify as more households face tighter discretionary budgets. And, third, government funding may remain unpredictable as public budgets respond to economic pressure and shifting political priorities.
As we (implore and) wait for policy makers to address these underlying issues, nonprofits should be focusing on building the foundations and systems for sustainability. Strong partnerships and collaborations, diversified revenue streams, distinctive positioning and assets, and broader reach help create the stability and visibility organizations are going to need to sustain their missions.
To dig deeper into the topic, organizations such as The Urban Institute, Brookings, or the Economic Policy Institute - along with Minneapolis resources such as Minnesota Economics Big Data Institute (MEBDI) - research, promote understanding and advocate on this issue.
Let me know what you think! Mike
mike@depauw-co.com